Climate
CASPCOM information resources, currently containing data catalogues of sea level, water temperature and surface runoff, will further be completed with new observations data and include new parameters. However they can currently be used to analyse and assess long-term changes of hydrometeorological conditions and Caspian Sea climate. This website section aims at making the results of this work available to the public.
It starts with the description of analysis and assessment technique. The baseline was set in 1961, when the data of hydrometeorological observations were put in order, and a unified zero mark was adopted for all the level gauges. In addition, this was the year when the flow of the Volga, which is the most important water source for the Caspian Sea, was regulated. In accordance with WMO recommendations, averaging time for the current measurements is set at 30 years' time. The analysis and assessment technique is made up of several stages. It is described using the example of mean annual sea water temperature at Makhachkala post.
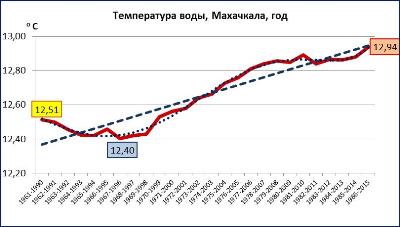
Stage 1. Source data visualization. At the first stage, the time series graph is drawn (in this case it is the mean annual water temperature in Makhachkala from 1961 to 2015), which is then smoothed by moving 30 years' periods (consequently by mean values for 1961-1990, 1962-1991...1986-2015). The graph contains the values of the first and the last points and the minimum and maximum values. In addition, the graph reflects linear and polynomial (to the fullest possible extent) trends.
Source data visualization helps determine the pattern of long-term variations of the selected parameter. In particular, the graph in Fig. 1 points to irregular growth of the mean annual sea water temperature in Makhachkala in 1961 - 2015. The statistical analysis shows that the positive linear trend presented in Fig. 1 has 0.10 Fisher's statistical significance level (and not significant at levels 0.05 and 0.01). According to Student, only a factor is significant (in trend equation y = ax+b) at all the mentioned significance levels (b factor is statistically insignificant). Residual autocorrelation by Durbin-Watson pointing to periodic fluctuations was noted.
|
|
|
enlarge
|
|
Fig. 1 Variations of mean annual sea water temperature in Makhachkala in 1965-2015 (оС), smoothed by moving 30 years' periods.
|
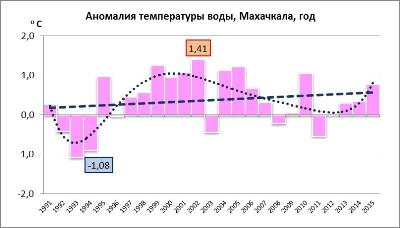
Stage 2. Anomalies calculation and analysis. An anomaly is the difference between the current year parameter and its mean value for the previous 30 years. As 1961 was selected as the baseline point for the source series, anomaly series start from 1991. The graph of anomalies (see Fig. 2) contains minimum and maximum values. In addition, this graph also reflects linear and polynomial (to the fullest possible extent) trends.
|
|
|
enlarge
|
|
Fig. 2 Anomalies of mean annual sea water temperature in Makhachkala in 1991-2015 (оС).
|
The anomalies graph helps trace the pattern of their variation within the considered time period. In particular, the graph presented in Fig. 2 shows that positive anomalies of the mean annual sea water temperature in Makhachkala were observed almost every year in the period 1997 - 2007.
The statistical analysis shows that the positive linear trend presented in Fig. 2 has 0.10 Fisher's statistical significance level (and not significant at levels 0.05 and 0.01). According to Student, the trend (a and b factors in trend equation y = ax+b) is statistically insignificant at all the mentioned levels. Residual autocorrelation by Durbin-Watson pointing to periodic fluctuations was not noted.
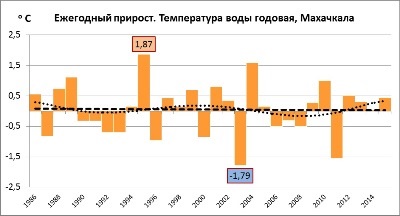
Stage 3. Increment calculation and analysis. An increment is the difference between the following and the previous values of the time series. The example in Fig. 3 shows the graph of annual increment of the mean annual water temperature in Makhachkala for the past 30 years (1986 - 2015). The Figure also shows maximum and minimum increment values registered within this period and both linear and polynomial trends.
|
|
|
enlarge
|
|
Fig. 3 Annual increment of mean annual sea water temperature in Makhachkala in 1986-2015 (оС).
|
The statistical analysis shows that the slightly pronounced negative linear trend presented in Fig. 3 has 0.10 Fisher's statistical significance level (and not significant at levels 0.05 and 0.01). According to Student, the trend (more exactly, a factor in trend equation y = ax+b) is also statistically significant at 0.10 level and insignificant at the other mentioned levels (b factor is statistically insignificant at all the levels). Residual autocorrelation by Durbin-Watson pointing to periodic fluctuations was not noted.
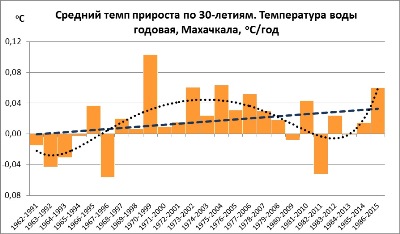
At this very stage mean 30 years' increments (starting from 1962-1991) of the studied parameters are calculated and analysed. Figure 4 shows the graph of increment rate of the annual water temperature in Makhachkala. It follows, that the highest growth rate (more than 0.1 оС/year) was observed in the last 30 years' period of the 20th century (1970 - 1999).
|
|
|
enlarge
|
|
Fig. 4 30 years' mean increments of the annual sea water temperature in Makhachkala in 1962-2015 (оС).
|
The statistical analysis shows that the positive linear trend presented in Fig. 4 has 0.10 Fisher's statistical significance level (and not significant at levels 0.05 and 0.01). According to Student, the trend (a and b factors in trend equation y = ax+b) was statistically insignificant at all the mentioned levels. Residual autocorrelation by Durbin-Watson pointing to periodic fluctuations was not noted.
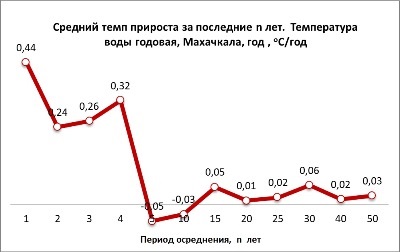
Mean increments of the considered parameters for the last n years are calculated at this stage, n being equal to 1, 2, 3, 4, 5, 10, 15, 20, 25, 30, 40 and 50 years. The graph of mean increments of sea water temperature in Makhachkala for n years is presented in Fig. 5. It follows that in the past 15-20 years sea water temperature in this area.
|
|
|
enlarge
|
|
Fig. 5 Mean increment of sea water annual temperature in Makhachkala for the past n years. Explanation is given in the text.
|
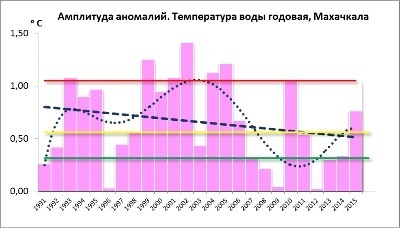
Stage 4. Assessment of anomaly and increment amplitude. Both of them, as can be seen in Figs. 2 and 3, can have positive and negative values, which can be seen in trends analysed above when the variations accumulate. At this stage, the temporal changes of amplitude of anomalies and increments are analysed. For this, series and graphs of their absolute values are drawn up. Then, quartiles are determined for temporal series of modulo anomalies and increments (separately for each of them). Anomalies are considered weak if their absolute value does not exceed the first quartile; they are average if their absolute value is between the first and the third quartiles (around the second quartile - the median); anomalies are strong if their absolute value exceeds the third quartile. Increments are assessed in a similar way.
Fig. 6 shows variations of anomaly amplitude of the annual water temperature in Makhachkala in 1991 - 2015. In addition, the figure shows linear and polynomial trends, and quartile values: the first quartile is represented by a green line, the second quartile - by a yellow line, and the third quartile - by a red line. As it follows from the graph, starting from 2006 to 2015 no strong water temperature anomalies were observed, although they were frequent in the early 2000s.
The statistical analysis shows that the negative linear trend presented in Fig. 6 has 0.10 Fisher's statistical significance level (and not significant at levels 0.05 and 0.01). According to Student, the trend (more exactly, a factor in trend equation y = ax+b) proved statistically significant at all the mentioned levels (vice versa, b factor is statistically insignificant at all the levels). Residual autocorrelation by Durbin-Watson pointing to periodic fluctuations was not noted.
|
|
|
enlarge
|
|
Fig. 6 Changes of anomaly amplitude of annual sea water temperature in Makhachkala in 1991-2015
|
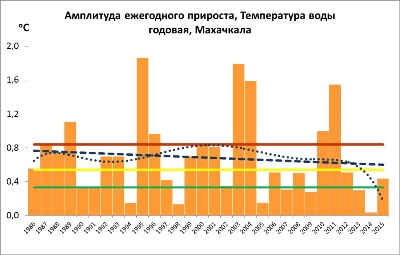
Fig. 7 shows variations of increment amplitude of the annual water temperature in Makhachkala in 1991 - 2015. In addition, the figure shows linear and polynomial trends, and quartile values: the first quartile is represented by a green line, the second quartile - by a yellow line, and the third quartile - by a red line. As it follows from the graph, within the considered time period (1986 - 2015) a peak of annual water temperature increment is observed every 7 - 8 years. However, on the whole, the increment amplitude was decreasing.
The statistical analysis shows that the negative linear trend presented in Fig. 7 has 0.10 Fisher's statistical significance level (and not significant at levels 0.05 and 0.01). According to Student, the trend (more exactly, a factor in trend equation y = ax+b) proved statistically significant at all the mentioned levels (vice versa, b factor is statistically insignificant at all the levels). Residual autocorrelation by Durbin-Watson pointing to periodic fluctuations was not noted, despite the pronounced periodic fluctuations of increment amplitude.
|
|
|
enlarge
|
|
Fig. 7 Changes of amplitude of annual sea water temperature increment in Makhachkala in 1986-2015
|
The analysis of long-term variability (including time series, trends, anomalies and increments) in line with the technique described above has been fulfilled for all the parameters contained in CASPCOM data catalogues (sea level, water temperature, river flow, including mean monthly, seasonal and annual values) for every observation point. The analysis results illustrated by tables and graphs are presented here.
|
|
|