|
|
|
|
 |
Atlas |
2005-12-06 |
|
|
We want to make this website applicable and useful both for specialists and all those who are interested in information about the Caspian Sea environment. Meteorological, hydrological and other maps of the Caspian region, which may be inaccessible for the public in other sources, will be placed on this page
Meteorological maps.
Maps atmosphere pressure and wind field (Denomination I-V):
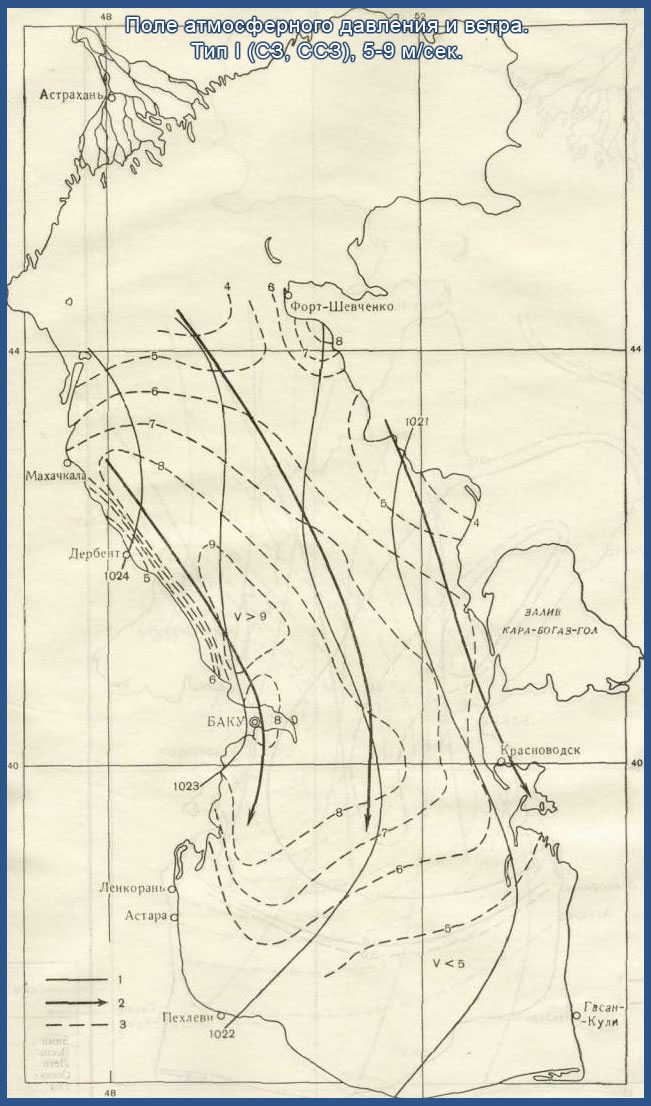
The atmosphere pressure and wind field. Denomination I(NW,NNW ),5-9 m/sec. map.jpg
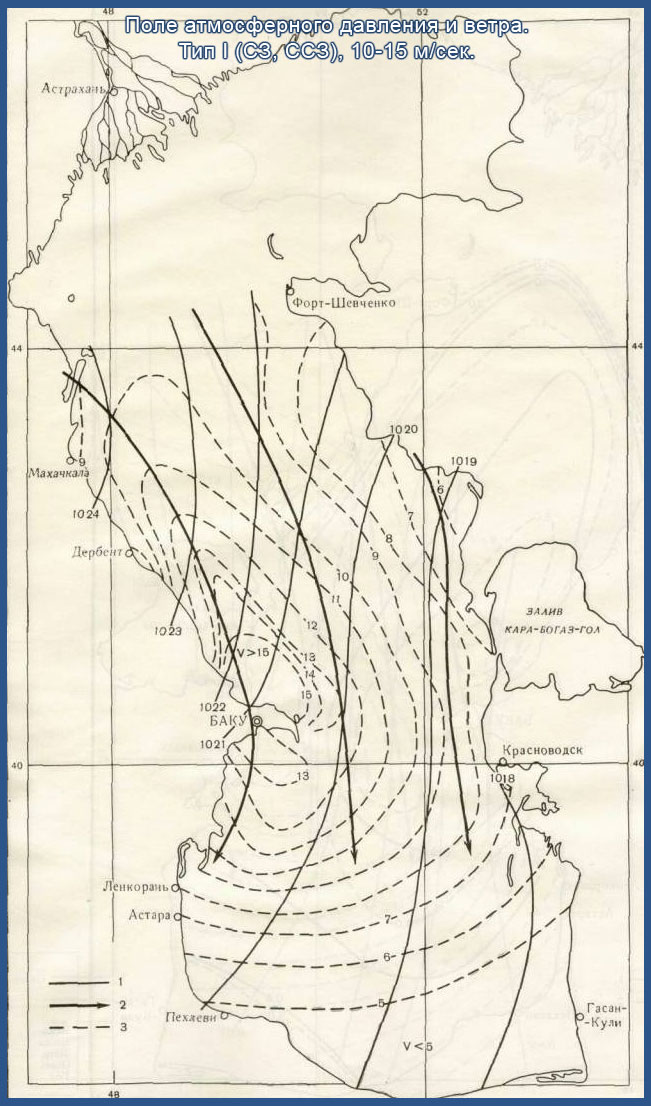
The atmosphere pressure and wind field. Denomination I(NW,NNW ),10-15 m/sec. map1.jpg
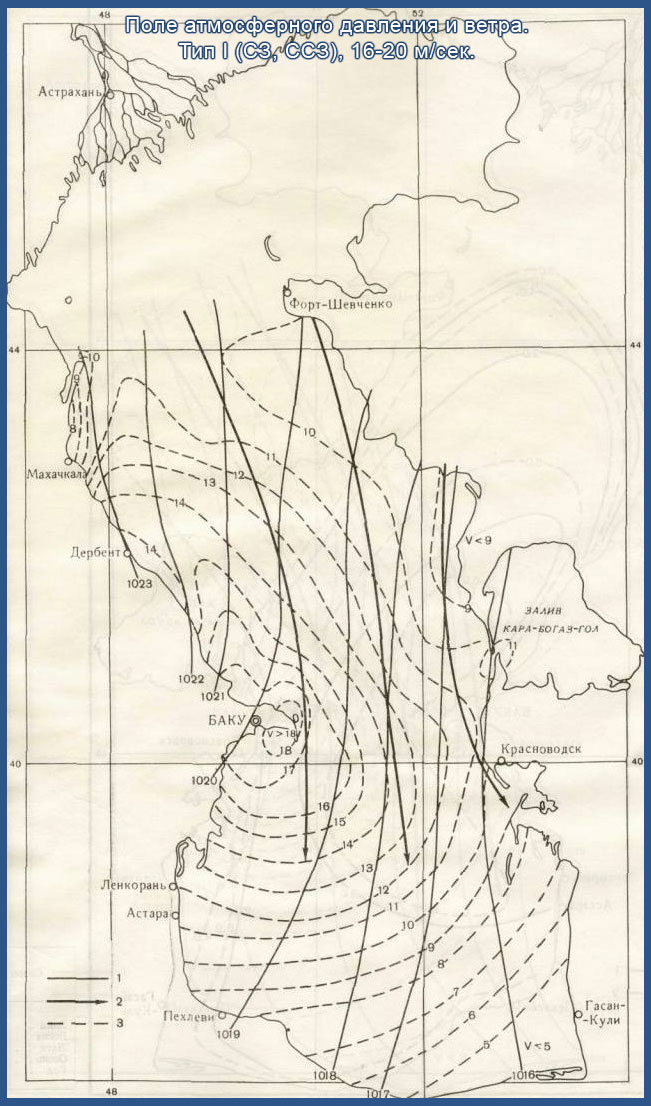
The atmosphere pressure and wind field. Denomination I(NW,NNW ),16-20 m/sec. map2.jpg
The atmosphere pressure and wind field. Denomination I(NW,NNW ),21-25 m/sec. map3.jpg
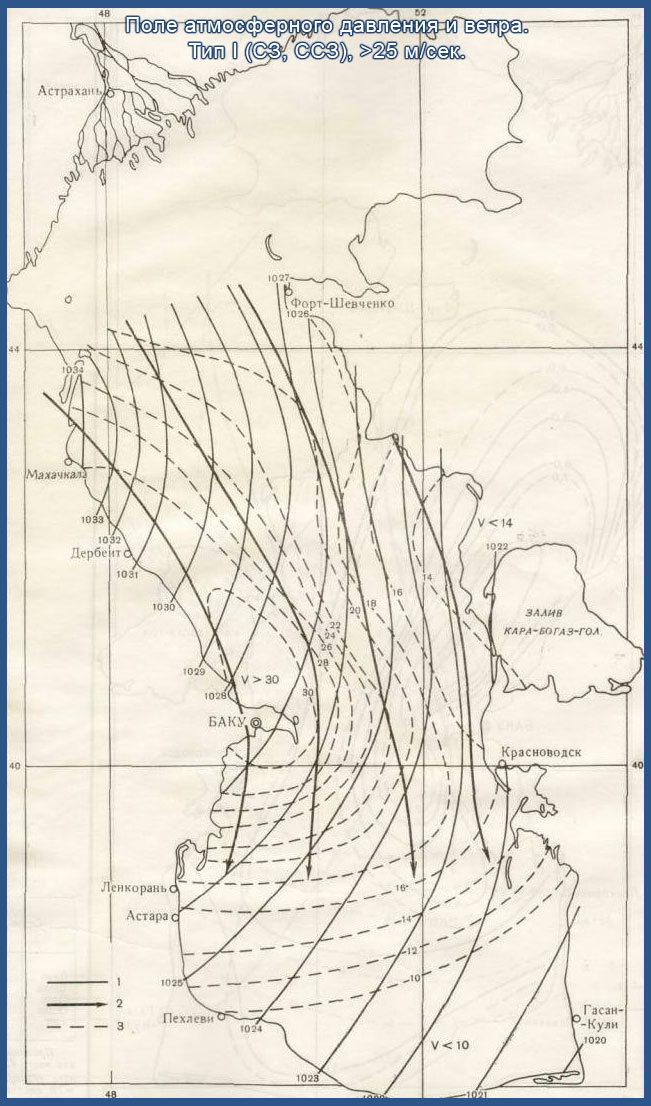
The atmosphere pressure and wind field. Denomination I(N,NNW ),>25 m/sec. map4.jpg
The atmosphere pressure and wind field. Denomination II(NE,NNE ),5-9 m/sec. map5.jpg
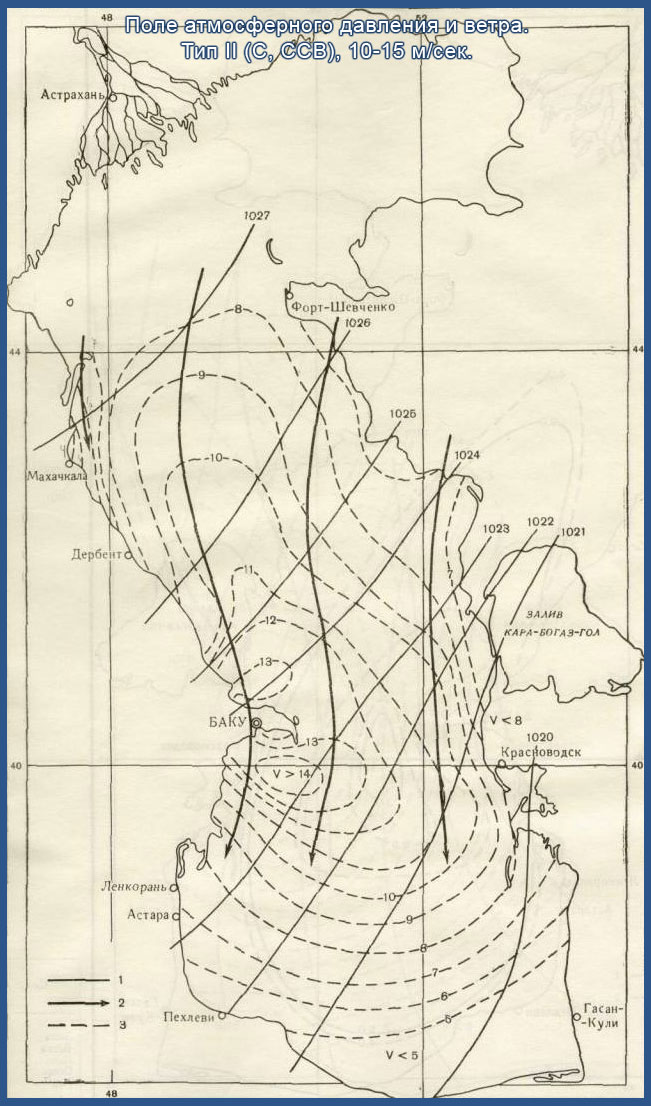
The atmosphere pressure and wind field. Denomination II(NE,NNE ),10-15 m/sec. map6.jpg
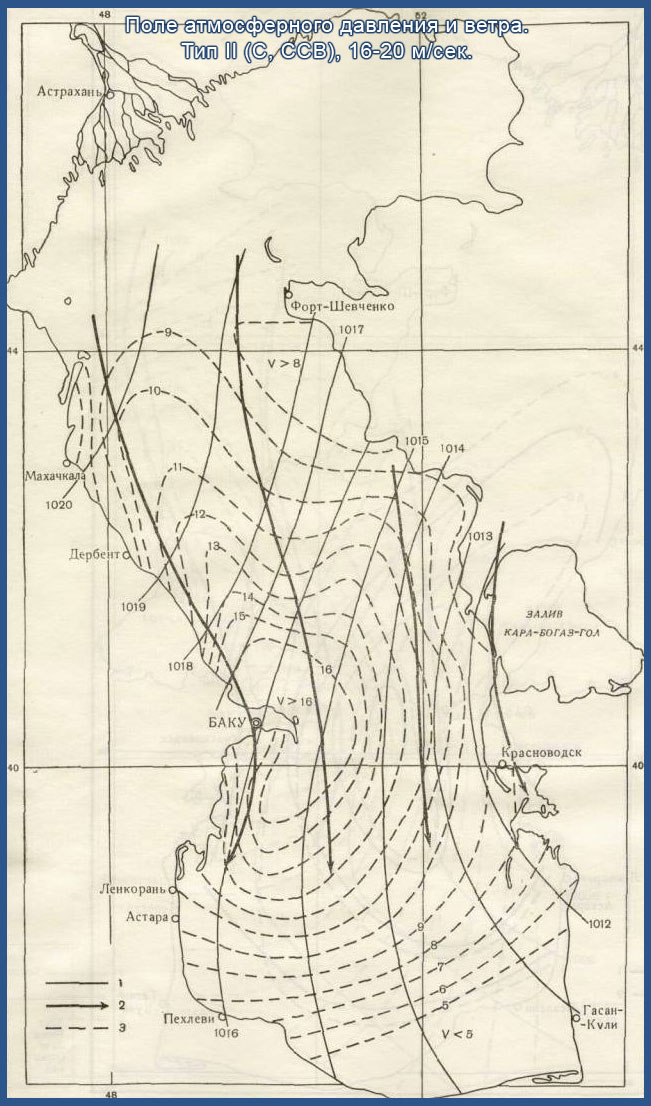
The atmosphere pressure and wind field. Denomination II(NE,NNE ),16-20 m/sec. map7.jpg
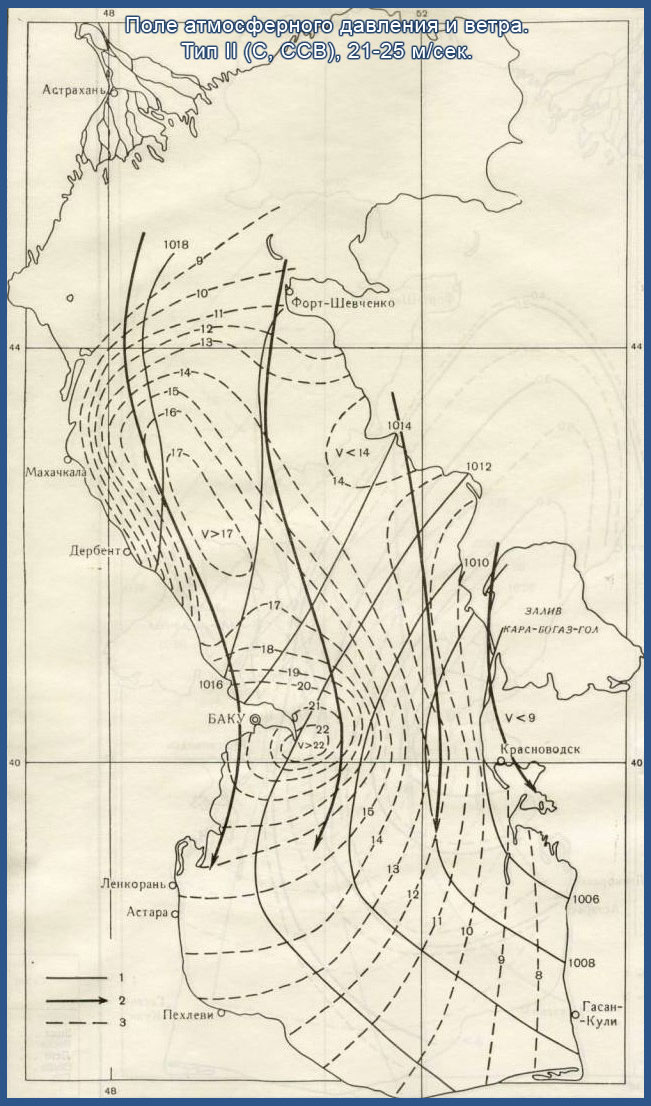
The atmosphere pressure and wind field. Denomination II(NE,NNE ),21-25 m/sec. map8.jpg
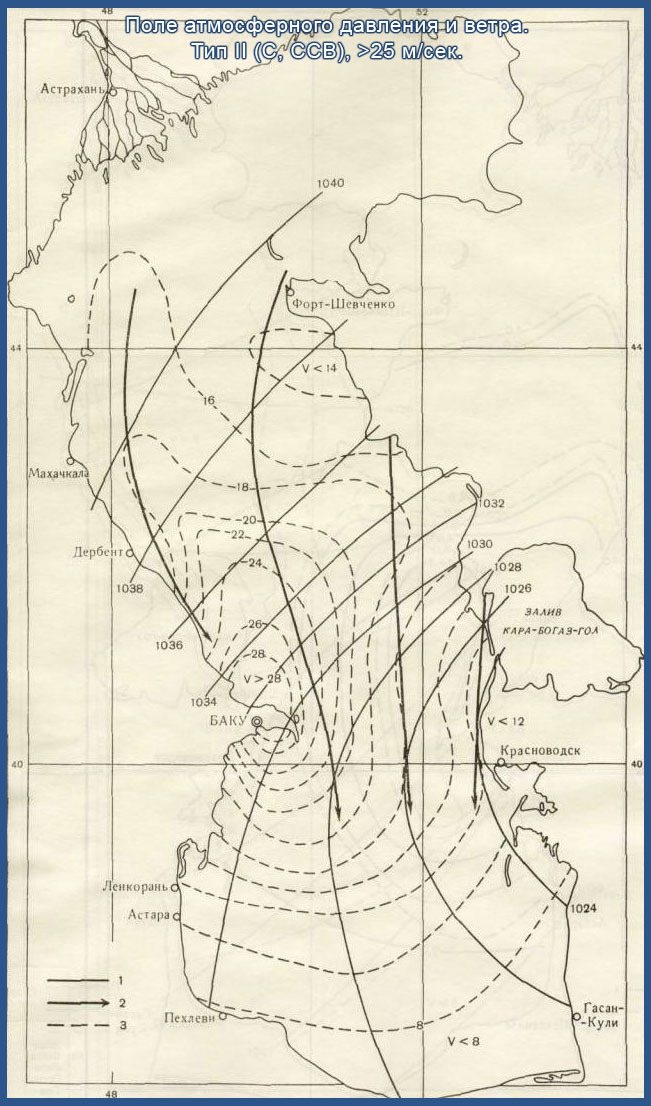
The atmosphere pressure and wind field. Denomination II(NE,NNE ),>25 m/sec. map9.jpg
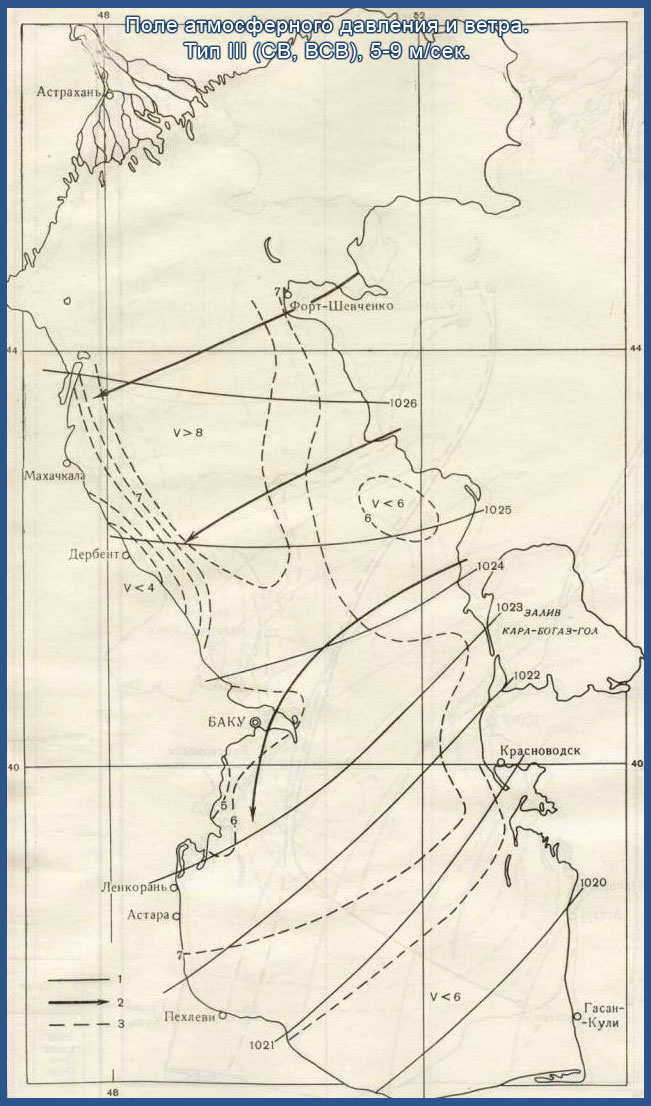
The atmosphere pressure and wind field. Denomination III(NE,ENE ),5-9 m/sec. map10.jpg
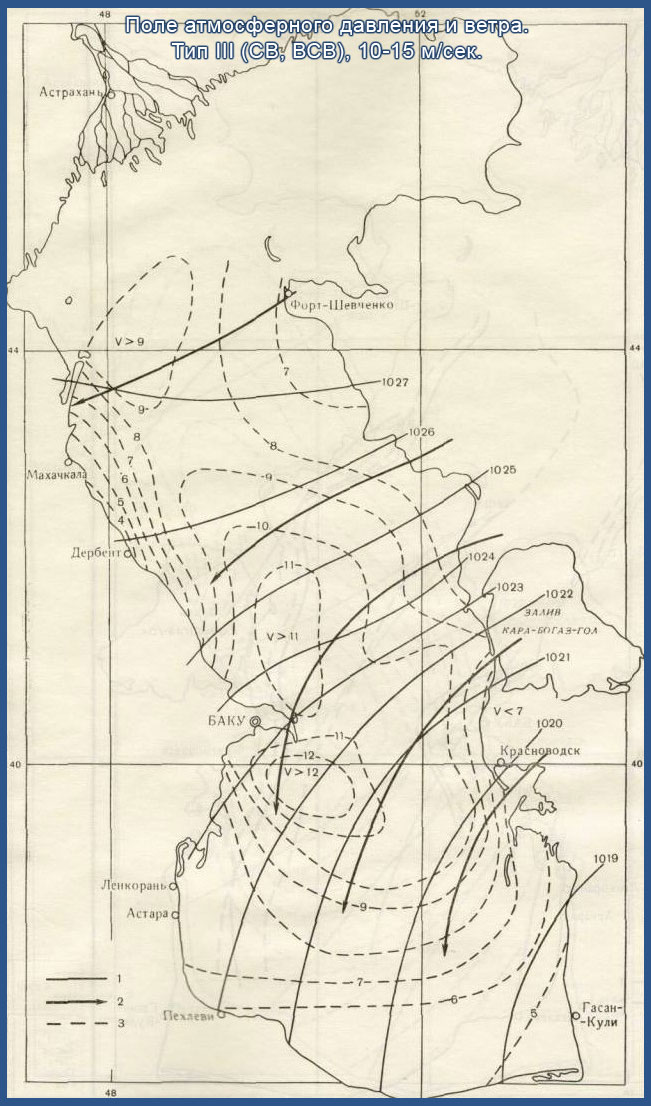
The atmosphere pressure and wind field. Denomination III(NE.ENE ),10-15 m/sec. map11.jpg
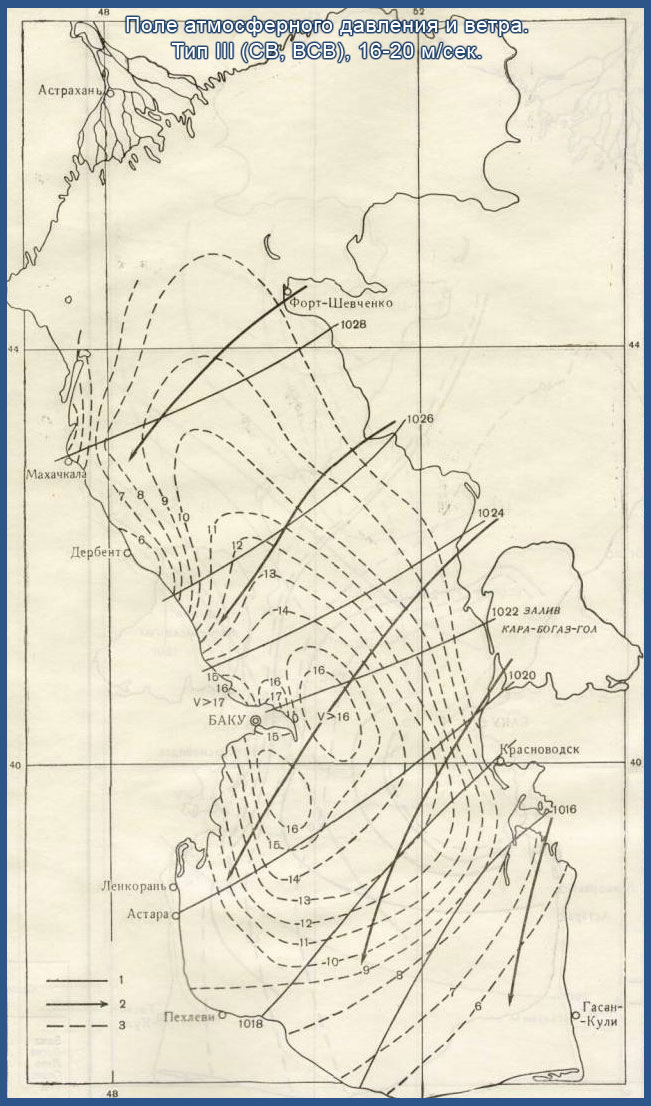
The atmosphere pressure and wind field. Denomination III(NE,ENE ),16-20 m/sec. map12.jpg
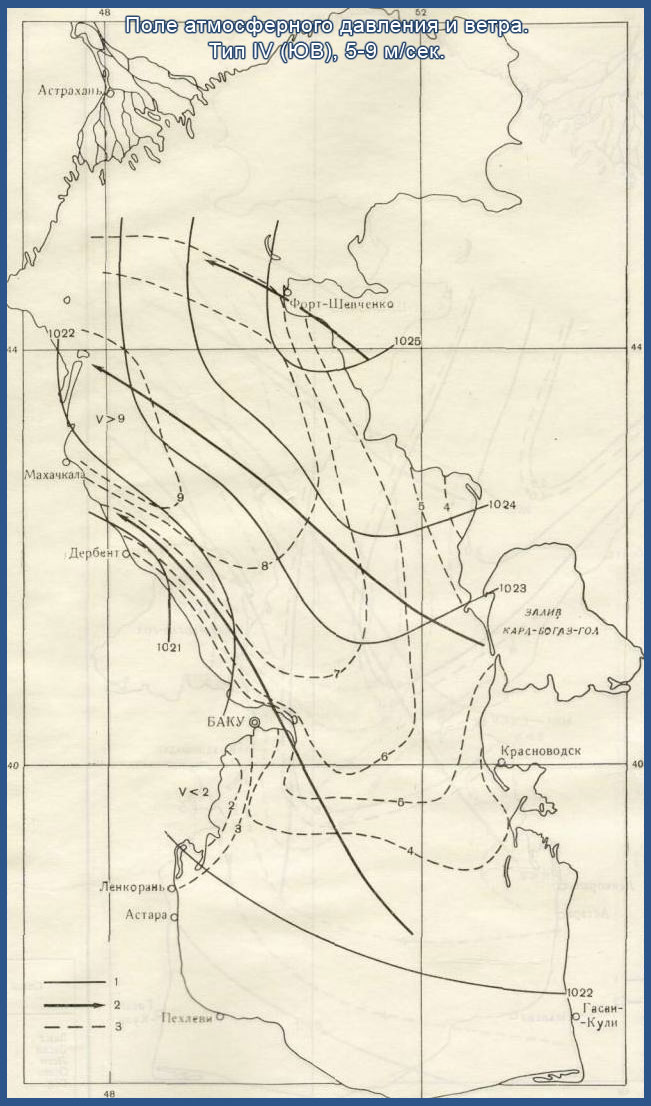
The atmosphere pressure and wind field. Denomination IY(SE ),5-9 m/sec. map13.jpg
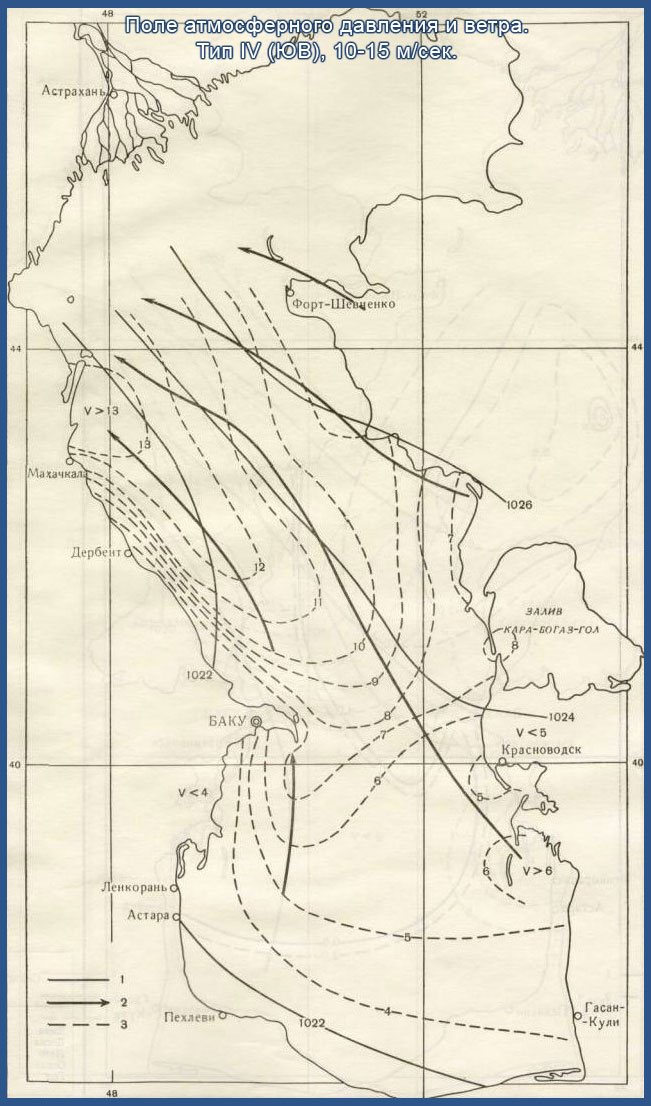
The atmosphere pressure and wind field. Denomination IY(SE ),10-15 m/sec. map14.jpg
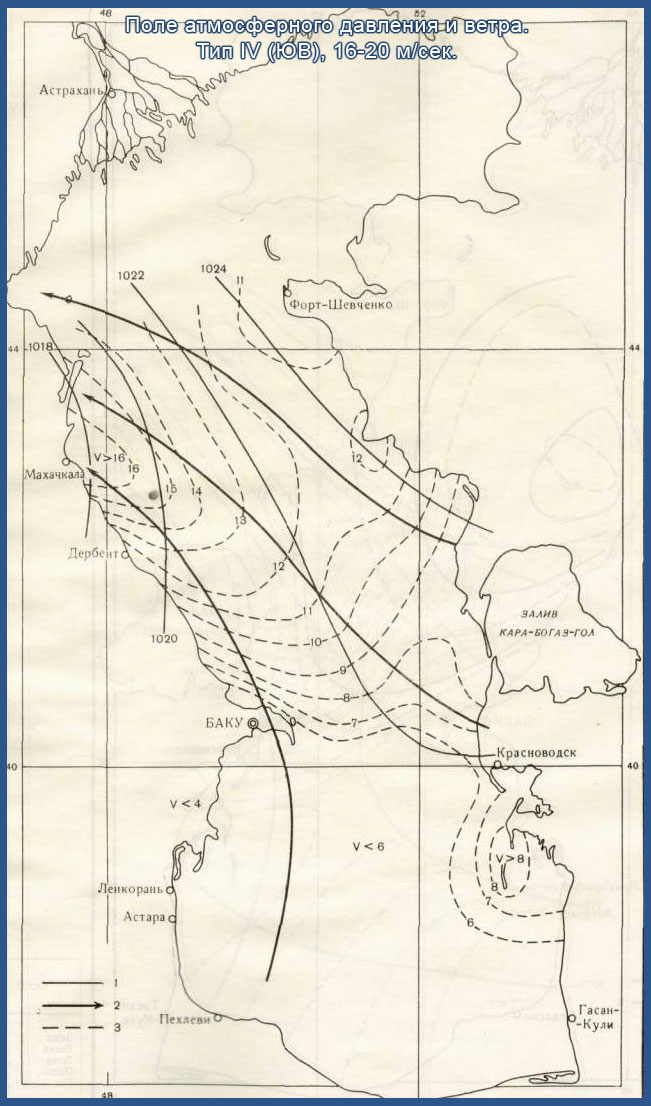
The atmosphere pressure and wind field. Denomination IY(SE ),16-20 m/sec. map15.jpg
The atmosphere pressure and wind field. Denomination IY(SE ),21-25 m/sec. map16.jpg
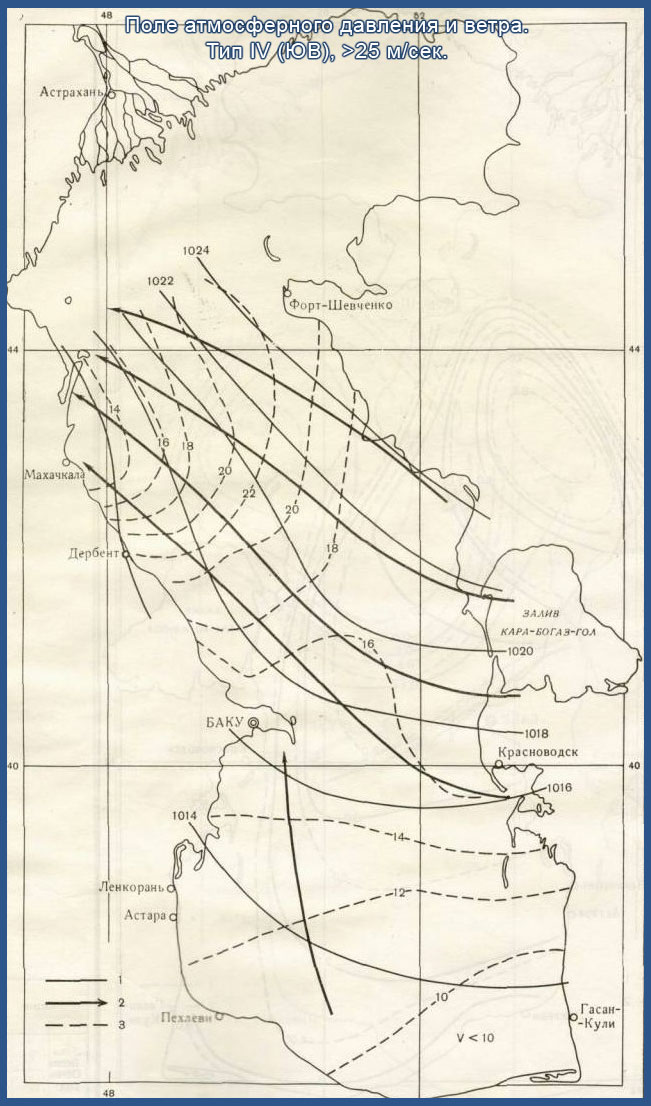
The atmosphere pressure and wind field. Denomination IY(SE ),>25 m/sec. map17.jpg
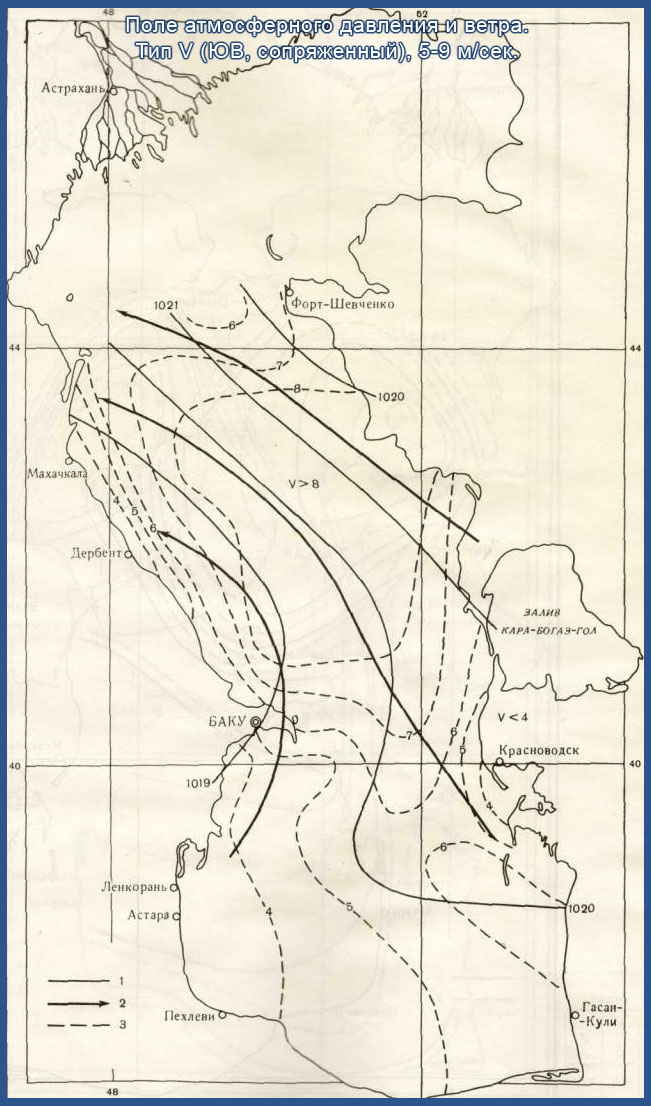
The atmosphere pressure and wind field. Denomination Y(SE, conjugate ),5-9 m/sec. map18.jpg
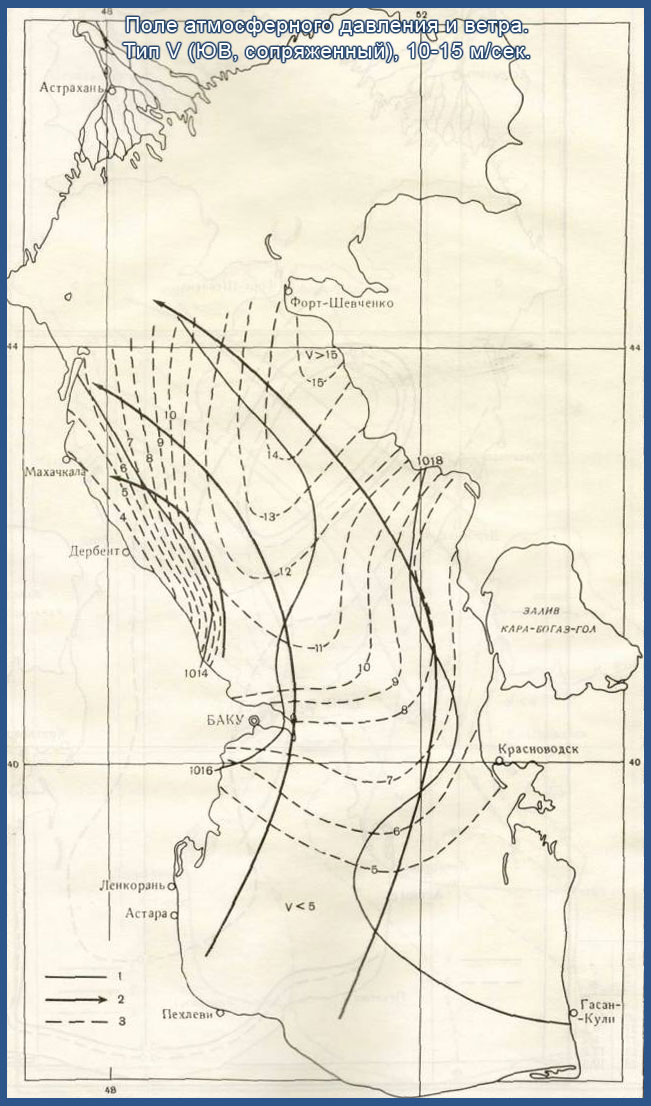
The atmosphere pressure and wind field. Denomination Y(SE, conjugate ),10-15 m/sec. map19.jpg
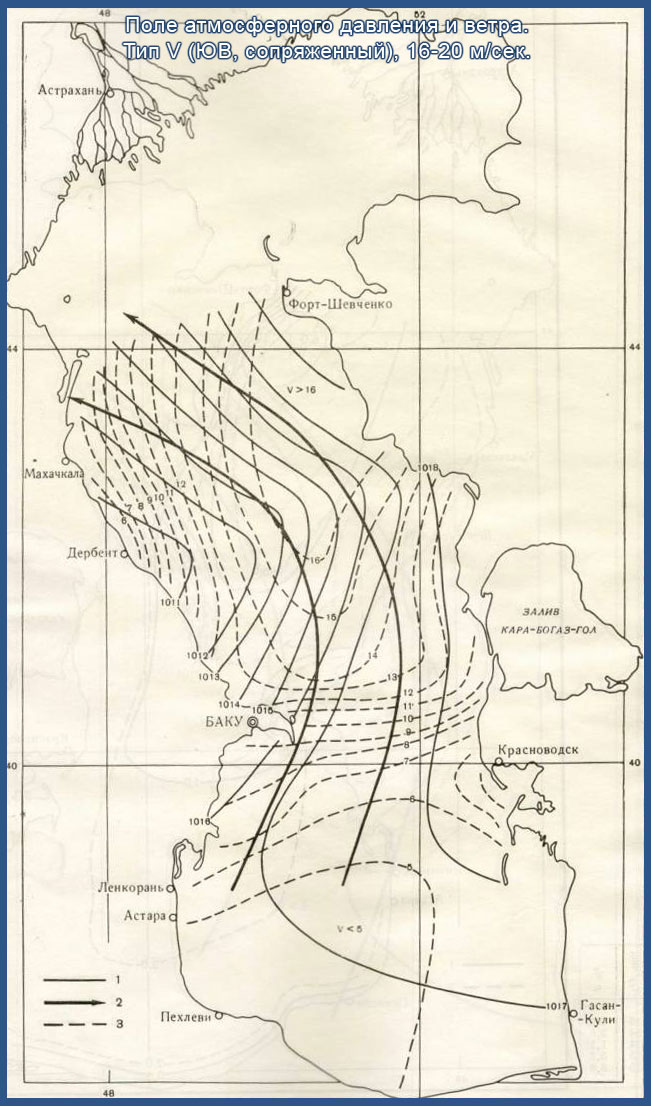
The atmosphere pressure and wind field. Denomination Y(SE , conjugate ),16-20 m/sec. map20.jpg
The atmosphere pressure and wind field. Denomination Y(SE , conjugate ),21-25 m/sec. map21.jpg
|
|
|
|
|
|
Maps waves fields (Denomination I - V): |
2005-12-06 |
|
|
Wave's field. Denomination I (NW,NNW ), 5-9 m/sec. map_wave.jpg
Wave's field. Denomination I (NW,NNW ),10-15 m/sec. map_wave1.jpg
Wave's field. Denomination I (NW,NNW ),16-20 m/sec. map_wave2.jpg
Wave's field. Denomination I (NW,NNW ),21-25 m/sec. map_wave3.jpg
Wave's field. Denomination I (N,NNW ),>25 m/sec. map_wave4.jpg
Wave's field. Denomination II (N,NNE ),5-9 m/sec. map_wave5.jpg
Wave's field. Denomination II NE,NNE( ),10-15 m/sec. map_wave6.jpg
Wave's field. Denomination II (NE-NNE ),16-20 m/sec. map_wave7.jpg
Wave's field. Denomination II (NE,NNE ),21-25 m/sec. map_wave8.jpg
Wave's field. Denomination II (NE,NNE ),>25 m/sec. map_wave9.jpg
Wave's field. Denomination III (NE,ENE ),5-9 m/sec. map_wave10.jpg
Wave's field. Denomination III (NE,ENE ),10-15 m/sec. map_wave11.jpg
Wave's field. Denomination III (NE,ENE ),16-20 m/sec. map_wave12.jpg
Wave's field. Denomination IY (SE ),5-9 m/sec. map_wave13.jpg
Wave's field. Denomination IY (SE ),10-15 m/sec. map_wave14.jpg
Wave's field. Denomination IY (SE ),16-20 m/sec. map_wave15.jpg
Wave's field. Denomination IY (SE ),21-25 m/sec. map_wave16.jpg
Wave's field. Denomination IY (SE ),>25 m/sec. map_wave17.jpg
Wave's field. Denomination IY (SE ),>25 m/sec. map_wave18.jpg
Wave's field. Denomination Y (SE conjugate ),5-9 m/sec. map_wave19.jpg
Wave's field. Denomination Y (, conjugate ),10-15 m/sec. map_wave20.jpg
Wave's field. Denomination Y (SE , conjugate ),16-20 m/sec. map_wave21.jpg
Wave's field. Denomination Y (, conjugate ),21-25 m/sec. map_wave22.jpg
|
|
|
|
|
|
Maps atmosphere pressure and wind field and wave's field |
2005-12-08 |
|
|
Denomination YI:
The atmosphere pressure and wind field. Denomination YI (turbulent, cyclic ),5-9 m/sec. map_d1.jpg
Wave's field. Denomination YI ( turbulent, cyclic ),5-9 m/sec. map_d2.jpg
The atmosphere pressure and wind field. Denomination YI(turbulent, cyclic ),10-15 m/sec. map_d3.jpg
Wave's field. Denomination YI (turbulent, cyclic ),10-15 m/sec. map_d4.jpg
The atmosphere pressure and wind field. Denomination YI(turbulent, cyclic ),16-20 m/sec. map_d5.jpg
Wave's field. Denomination YI (turbulent, cyclic ),16-20 m/sec. map_d6.jpg
The atmosphere pressure and wind fiel in April (weakly stable atmosphere stratification), West denomination,10-15 m/sec. (by L.N. Ikonnikova). map_d7.jpg
Wave's field in april.Wesy denomination , 10-15m/sec, (by L.N. Ikonnikova), the repeatability 0.38%. map_d8.jpg
The atmosphere pressure and wind field in December ( The equilibrium quantity of the atmosphere stratification). The West denomination), 10-15 m/sec. (by L.N. Ikonnikova). map_d9.jpg
Wave's field in December. The West denomination), 10-15 m/sec,the repeatability 0.25%. map_d10.jpg
|
|
|
|
|
|
The regime information |
2005-12-08 |
|
|
The generalized extremefield of the wave's height and wind speed. map_r.jpg
The generalized extremefield of the average wave's periods. map_r1.jpg
The rate supply of the wave's heights, above then 1m. map_r2.jpg
The rate supply of the wave's heights, above then 3m. map_r3.jpg
The rate supply of the wave's heights, above then 5m. map_r4.jpg
The wind field , accords to the storm model I( NW,NNW) 26X1948year. map_r5.jpg
The wave field , accords to the storm model I( NW,NNW) 26X1948year. map_r6.jpg
The wind field , accords to the North storm model, 12-14 II 1952year. (by L.N. Ikonnikova). map_r7.jpg
The wave field , accords to North storm model, 12-14 II 1952year. (by L.N. Ikonnikova). map_r8.jpg
The wind field , accords to the North storm model, 1-2 III 1952year. (by L.N. Ikonnikova). map_r9.jpg
The wave field , accords to North storm model, 1-2 III 1952year. (by L.N. Ikonnikova). map_r10.jpg
The wind field , accords to the South (South-East) storm model, 10-14X1952year. (by L.N. Ikonnikova). map_r11.jpg
The wave field , accords to the South(South-East) storm model10-14X 1952year. (by L.N. Ikonnikova). map_r12.jpg
The wind field , accords to the storm model,(NW,NNW) 20-21 XI 1957 year. (by S.D. Kashinskiy). map_r13.jpg
The wave field , accords to the storm model, (NW,NNW) 20-21 1957year. (by L.G. Tambovseva). map_r14.jpg
|
|
|
|
|
|
Climat |
2005-12-09 |
|
|
Picture 1. The water temperature (îŃ) on the horison 0 m, January map_t1.jpg
Picture 2. The water temperature (îŃ) on the horison 0 m, February map_t2.jpg
Picture 3. The water temperature (îŃ) on the horison 0 m, March map_t3.jpg
Picture 4. The water temperature (îŃ) on the horison 0 m, April map_t4.jpg
Picture 5. The water temperature (îŃ) on the horison 0 m, May map_t5.jpg
Picture 6. The water temperature (îŃ) on the horison 0 m, June map_t6.jpg
Picture 7. The water temperature (îŃ) on the horison 0 m, July map_t7.jpg
Picture 8. The water temperature (îŃ) on the horison 0 m, August map_t8.jpg
Picture 9. The water temperature (îŃ) on the horison 0 m, September map_t9.jpg
Picture 10. The water temperature (îŃ) on the horison 0 m, October map_t10.jpg
Picture 11. The water temperature (îŃ) on the horison 0 m, November map_t11.jpg
Picture 12. The water temperature (îŃ) on the horison 0 m, December map_t12.jpg
Picture 13. The water temperature (îŃ) on the horison 20 m, January map_t13.jpg
Picture 14. The water temperature (îŃ) on the horison 20 m, February map_t14.jpg
Picture 15. The water temperature (îŃ) on the horison 20 m, March map_t15.jpg
Picture 16. The water temperature (îŃ) on the horison 20 m, April map_t16.jpg
Picture 17. The water temperature (îŃ) on the horison 20 m, May map_t17.jpg
Picture 18. The water temperature (îŃ) on the horison 20 m, June map_t18.jpg
Picture 19. The water temperature (îŃ) on the horison 20 m, July map_t19.jpg
Picture 20. The water temperature (îŃ) on the horison 20 m, August map_t20.jpg
|
|
|
|
|
|
Climat-2 |
2005-12-09 |
|
|
Picture 21. The water temperature (îŃ) on the horison 20 m, September map_t21.jpg
Picture 22. The water temperature (îŃ) on the horison2 0 m, October map_t22.jpg
Picture 23. The water temperature (îŃ) on the horison 20 m, November map_t23.jpg
Picture 24. The water temperature (îŃ) on the horison 20 m, December map_t24.jpg
Picture 25. The water temperature (îŃ) on the horison 50 m, January map_t25.jpg
Picture 26. The water temperature (îŃ) on the horison 50 m, February map_t26.jpg
Picture 27. The water temperature (îŃ) on the horison 50 m, March map_t27.jpg
Picture 28. The water temperature (îŃ) on the horison 50 m, April map_t28.jpg
Picture 29. The water temperature (îŃ) on the horison 50 m, May map_t29.jpg
Picture 30. The water temperature (îŃ) on the horison 50 m, June map_t30.jpg
Picture 31. The water temperature (îŃ) on the horison 50 m, July map_t31.jpg
Picture 32. The water temperature (îŃ) on the horison 50 m, August map_t32.jpg
Picture 33. The water temperature (îŃ) on the horison 50 m, September map_t33.jpg
Picture 34. The water temperature (îŃ) on the horison 50 m, October map_t34.jpg
Picture 35. The water temperature (îŃ) on the horison 50 m, November map_t35.jpg
Picture 36. The water temperature (îŃ) on the horison 50 m, December map_t36.jpg
Picture 37. The water temperature (îŃ) on the horison 100 m, February map_t37.jpg
Picture 38. The water temperature (îŃ) on the horison 100 m, April map_t38.jpg
Picture 39. The water temperature (îŃ) on the horison 100 m, August map_t39.jpg
Picture 40. The water temperature (îŃ) on the horison 100 m, November map_t40.jpg
|
|
|
|
|
|
Climat-3 |
2005-12-09 |
|
|
Picture 41. The water salinity (î/îî) on the horison 0 m, January map_s1.jpg
Picture 42. The water salinity (î/îî) on the horison 0 m, February map_s2.jpg
Picture 43. The water salinity (î/îî) on the horison 0 m, March map_s3.jpg
Picture 44. The water salinity (î/îî) on the horison 0 m, April map_s4.jpg
Picture 45. The water salinity (î/îî) on the horison 0 m, May map_s5.jpg
Picture 46. The water salinity (î/îî) on the horison 0 m, June map_s6.jpg
Picture 47. The water salinity (î/îî) on the horison 0 m, July map_s7.jpg
Picture 48. The water salinity (î/îî) on the horison 0 m, August map_s8.jpg
Picture 49. The water salinity (î/îî) on the horison 0 m, September map_s9.jpg
Picture 50. The water salinity (î/îî) on the horison 0 m, Ocnober map_s10.jpg
Picture 51. The water salinity (î/îî) on the horison 0 m, November map_s11.jpg
Picture 52. The water salinity (î/îî) on the horison 0 m, December map_s12.jpg
Picture 53. The water salinity (î/îî) on the horison 20 m, February map_s13.jpg
Picture 54. The water salinity (î/îî) on the horison 20 m, April map_s14.jpg
Picture 55. The water salinity (î/îî) on the horison 20 m, August map_s15.jpg
Picture 56. The water salinity (î/îî) on the horison 20 m, November map_s16.jpg
Picture 57. The water salinity (î/îî) on the horison 50 m, February map_s17.jpg
Picture 58. The water salinity (î/îî) on the horison 50 m, April map_s18.jpg
Picture59. The water salinity (î/îî) on the horison 50 m, August map_s19.jpg
Picture60. The water salinity (î/îî) on the horison 50 m, November map_s20.jpg
|
|
|
| |
|
|
|
|


